
TVS 1900 / 2300 Flow / Efficeny Maps
 Jan 9, 2009 | 12:41 PM
#1

Thread Starter

Joined: Mar 1986
Posts: 18,749
Likes: 8
From: Chatsworth, CA
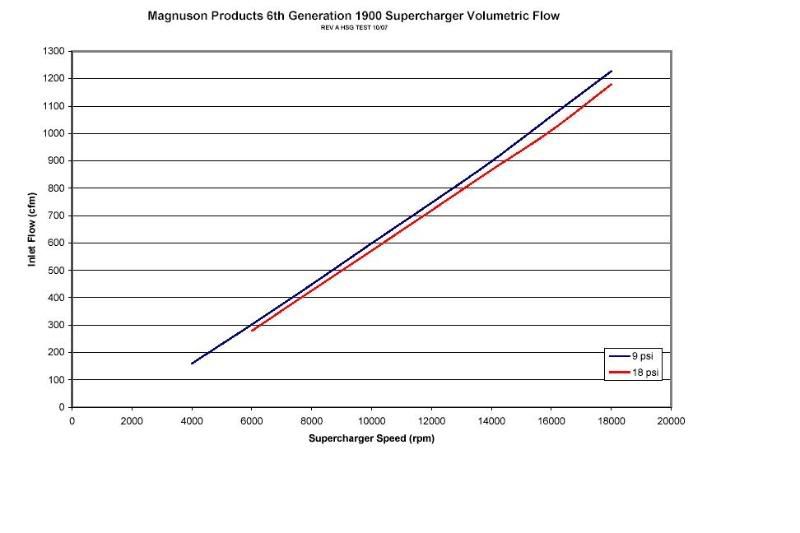
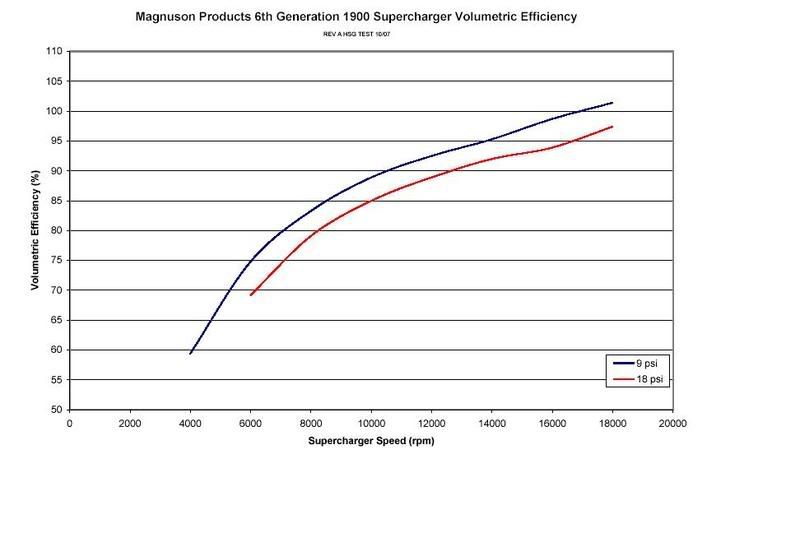
1900:
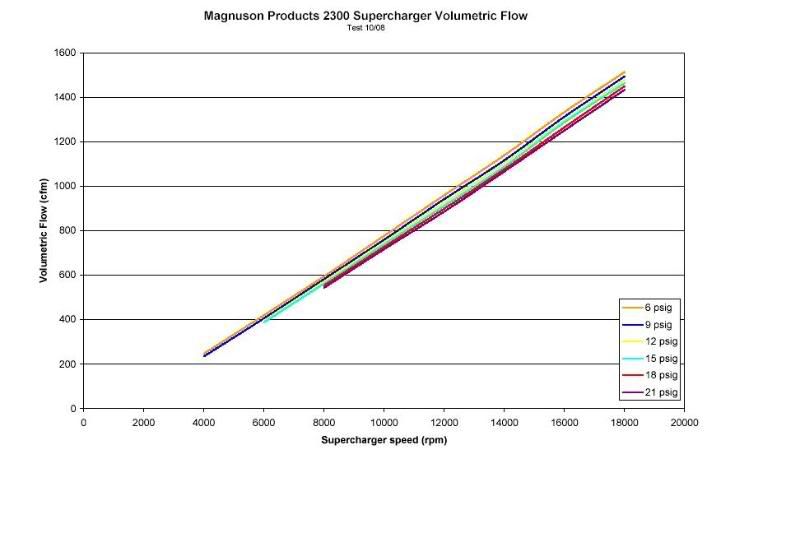
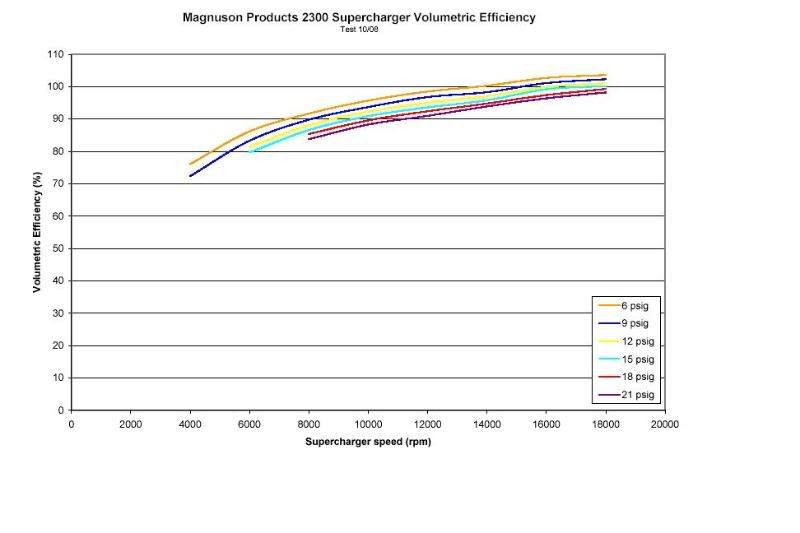
2300:
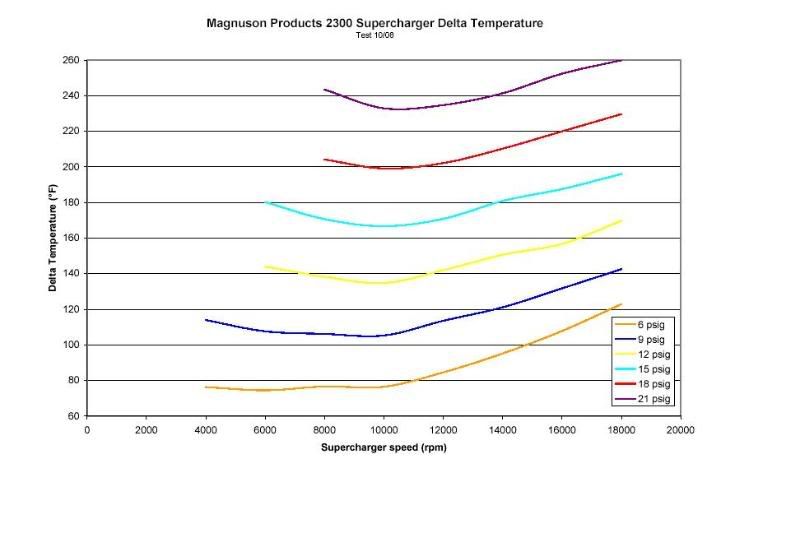
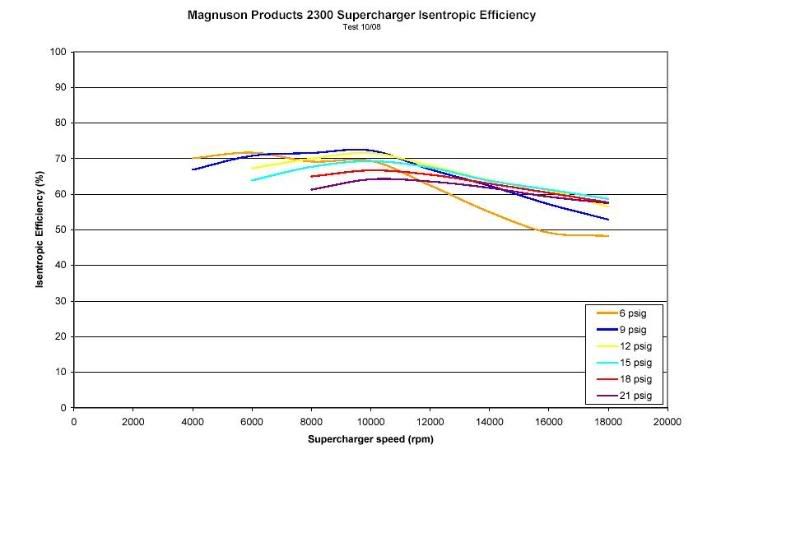
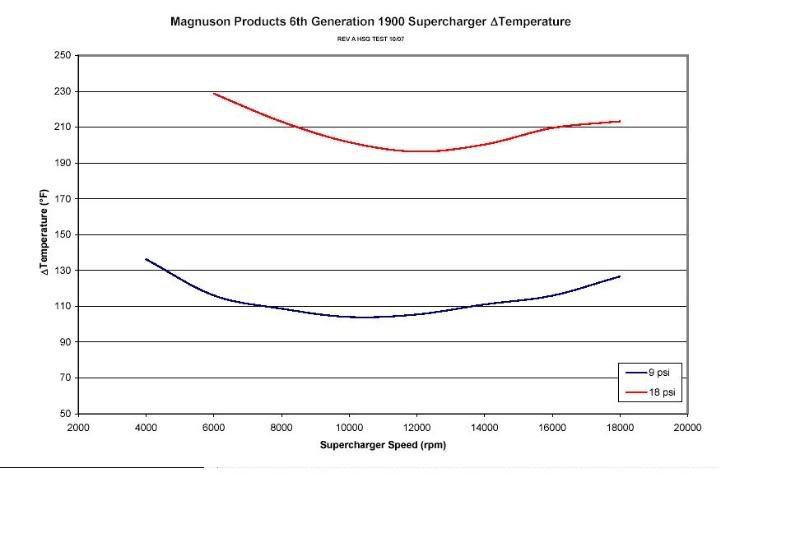
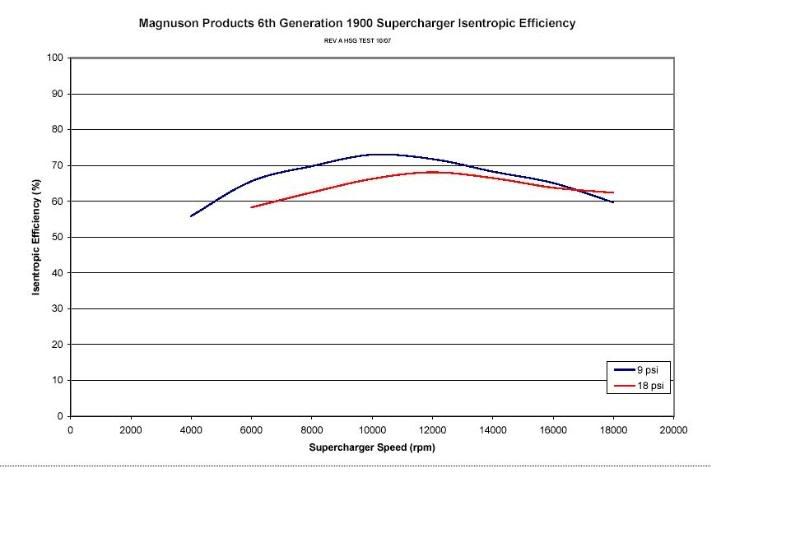
These tests were preformed to SAE standards....and before you yahoos make a comment about the temperature graph....This is on a test stand withOUT an intercooler core. I would like to see a screw, turbo, centrifugal come close to these numbers.
2300:
These tests were preformed to SAE standards....and before you yahoos make a comment about the temperature graph....This is on a test stand withOUT an intercooler core. I would like to see a screw, turbo, centrifugal come close to these numbers.
Last edited by BlownChevy; Jan 9, 2009 at 01:19 PM. Reason: added 2300 maps
Jan 9, 2009 | 01:01 PM
#3

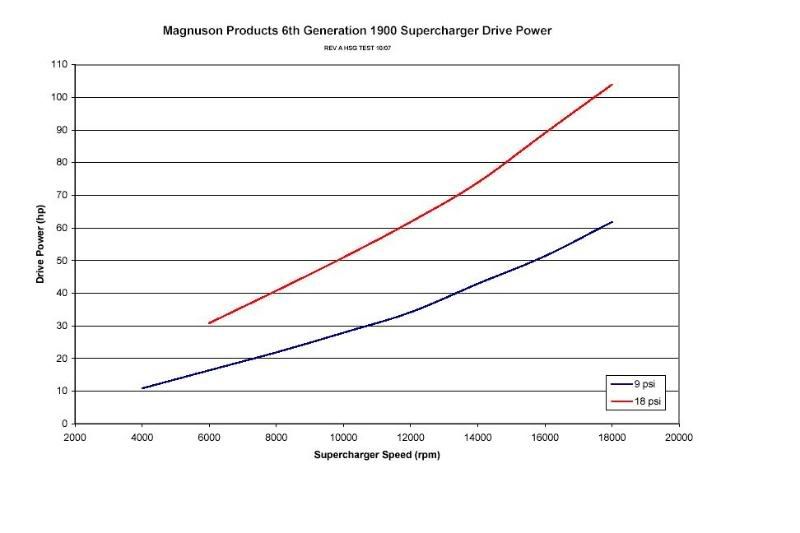
Thanks for the info. These seem to coincide with the Eaton TVS info we were given a year ago. Drive power and temperature appear to be much improved compared to the MP112.
Now quit wasting time testing stuff and send me my TVS!
Now quit wasting time testing stuff and send me my TVS!
Jan 9, 2009 | 01:05 PM
#4
Thread Starter
Joined: Mar 1986
Posts: 18,749
Likes: 8
From: Chatsworth, CA
Note the VE is up over 100% @ 9psi and 18K rpm....and it shows NO sign of tipping over. Even at 18psi the VE is up close to 100% (98) @ 18K RPM.

 Jan 9, 2009 | 01:54 PM
#6

 Jan 9, 2009 | 01:57 PM
#7
Thread Starter
Joined: Mar 1986
Posts: 18,749
Likes: 8
From: Chatsworth, CA
Trending Topics
Jan 9, 2009 | 02:08 PM
#9
Thread Starter
Joined: Mar 1986
Posts: 18,749
Likes: 8
From: Chatsworth, CA
Jan 9, 2009 | 02:13 PM
#10

I was just thinking a larger blower would moved more air per rev so I was just thinking the air would be cooler for the same revs.
Oh and I do like the charts lots of good data there.